
You’ve migrated your data to Airtable, and your information is now structured in a way that makes logical sense. But if you’re still primarily looking at rows and columns of data, you’re missing out on one of Airtable’s most powerful capabilities: data visualization.
Unlike traditional spreadsheets where you’re limited to the same tabular view of your data (with perhaps some conditional formatting), Airtable allows you to visualize the same information in multiple ways simultaneously. This isn’t just about making your data look pretty – it’s about making it actionable and insightful for different contexts and team members. Think of it as giving your data spreadsheets on steroids.
Let’s explore how Airtable’s diverse visualization options can transform how you interact with your data and streamline your workflows.
Views: The Secret Weapon That Spreadsheets Don’t Have
While spreadsheets offer tabs to organize different sets of data, Airtable’s views are fundamentally different. Views allow you to look at the same data through different lenses, each optimized for specific purposes.
Here’s what makes Airtable views so powerful:
- No data duplication – Every view shows the same underlying data, eliminating version control issues
- Real-time updates – Changes made in any view reflect across all views instantly
- Purpose-built visualizations – Each view type is optimized for specific use cases and workflows
- Customizable permissions – Views can be shared selectively with different stakeholders
This is a game-changer for businesses managing complex workflows or teams with diverse needs.
A Guide to Airtable View Types
Let’s break down each view type and when to use it:
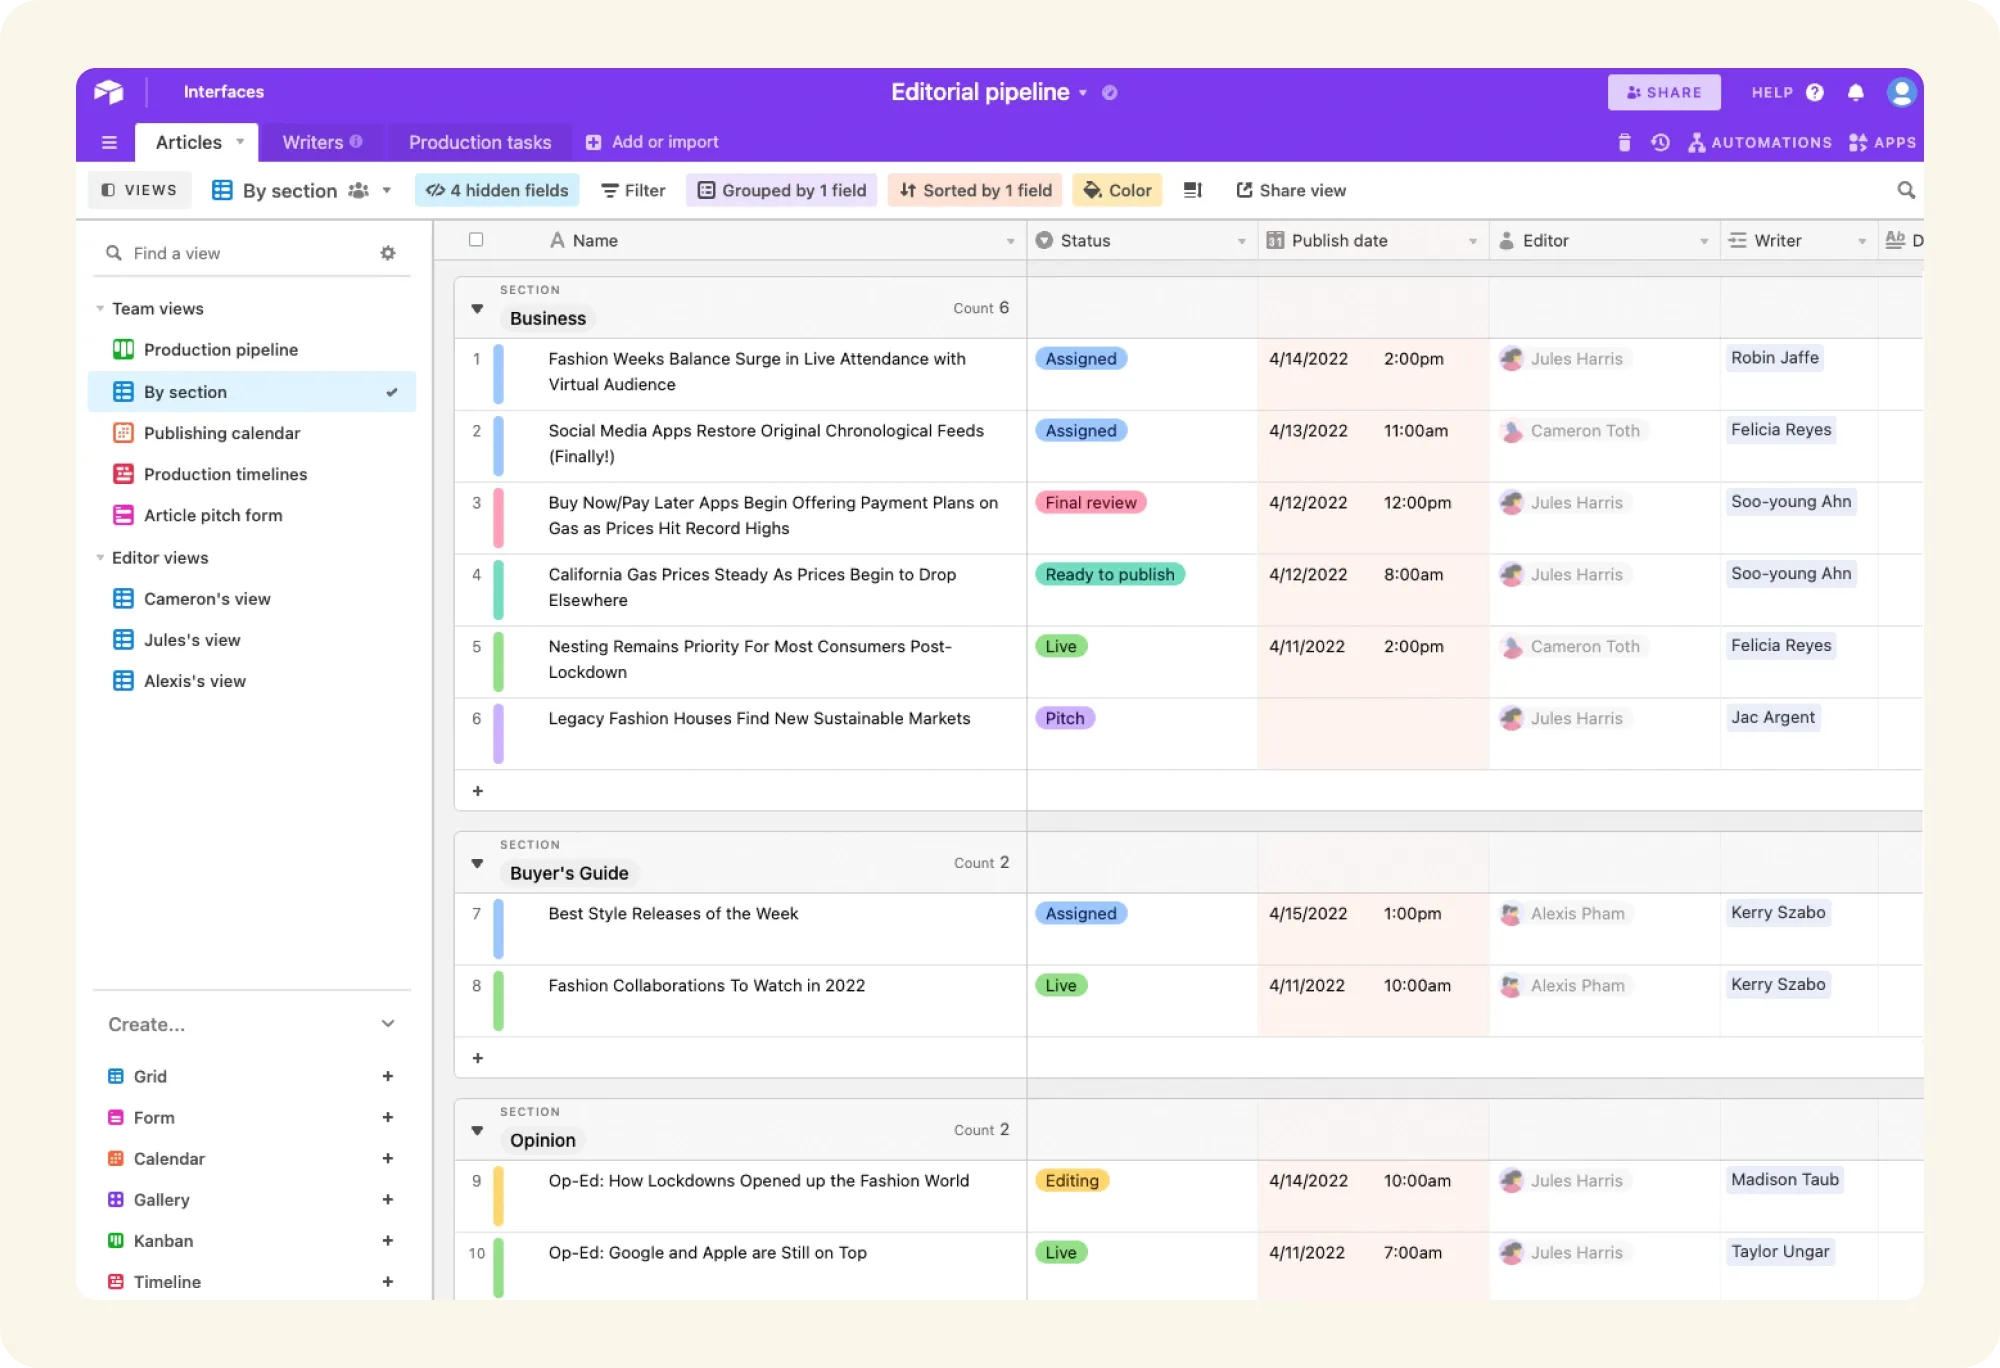
Grid View: Your Home Base
The Grid View is likely where you’ll spend most of your time. It’s similar to a spreadsheet’s row-and-column format but with significant enhancements:
- Sorting – Arrange records by any field (e.g., due date, priority)
- Filtering – Show only records matching specific criteria
- Grouping – Cluster records by category, status, or any field
- Conditional formatting – Highlight cells based on their values
- Field visibility control – Show only relevant fields for specific purposes
Pro Tip: Create multiple Grid Views for different contexts – a “Data Entry” view with all fields visible, a “Management Overview” view with key metrics, and task-specific views that highlight only relevant information.
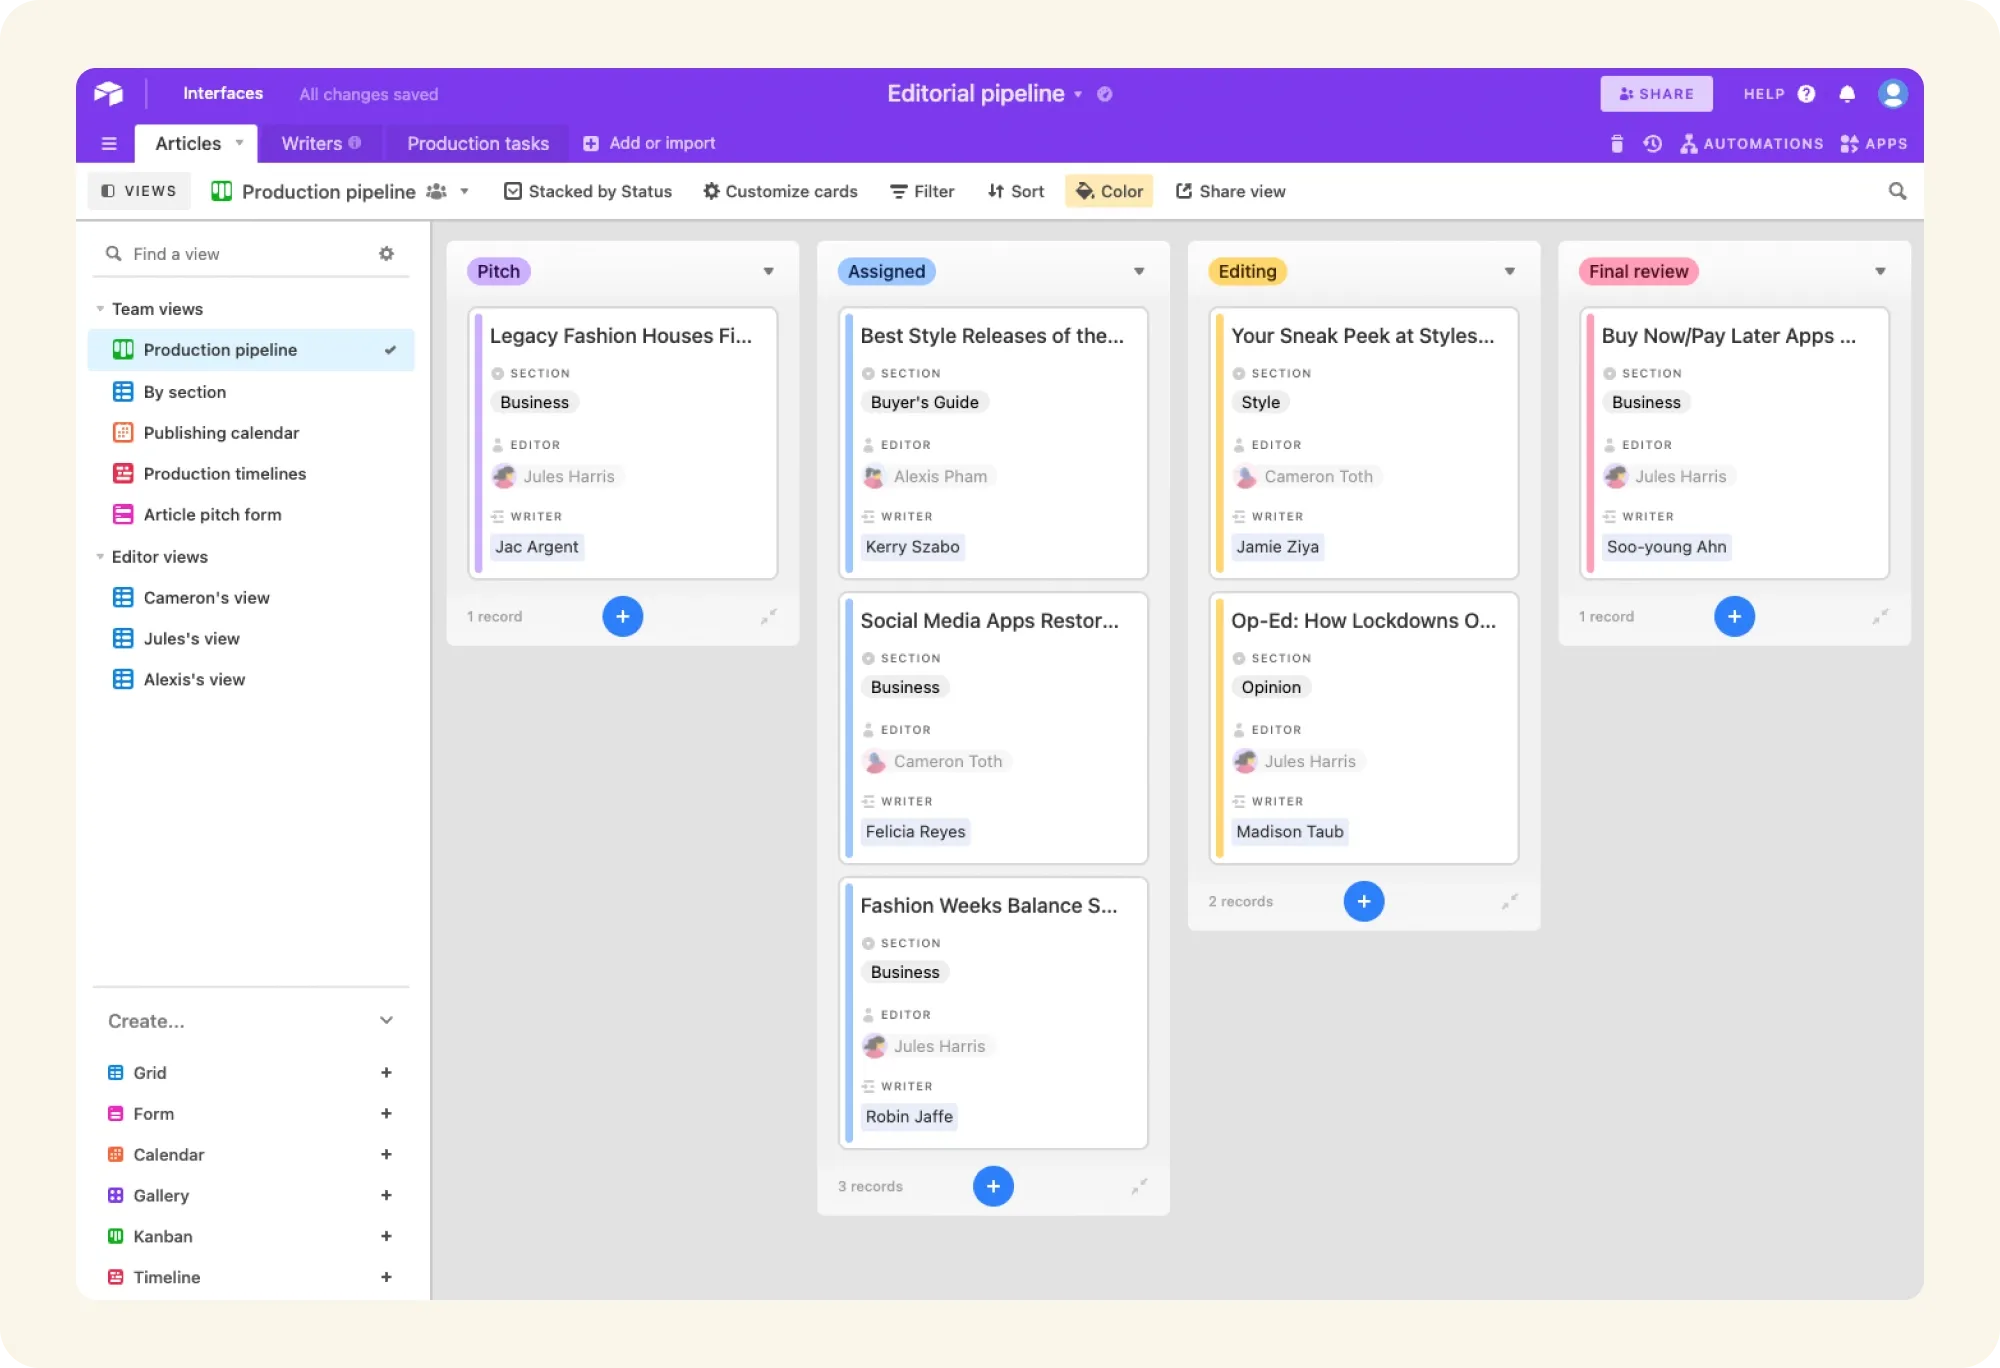
Kanban View: Visual Workflow Management
Kanban View organizes your records into card stacks, typically grouped by status or stage. This view is ideal for:
- Project management (moving tasks through planning, in-progress, review, complete)
- Sales pipelines (tracking leads through qualification, proposal, negotiation, closed)
- Content calendars (organizing content by ideation, drafting, editing, scheduled, published)
- Recruitment (moving candidates through application, screening, interview, offer)
The visual nature of Kanban makes it instantly clear where bottlenecks exist and what needs attention.
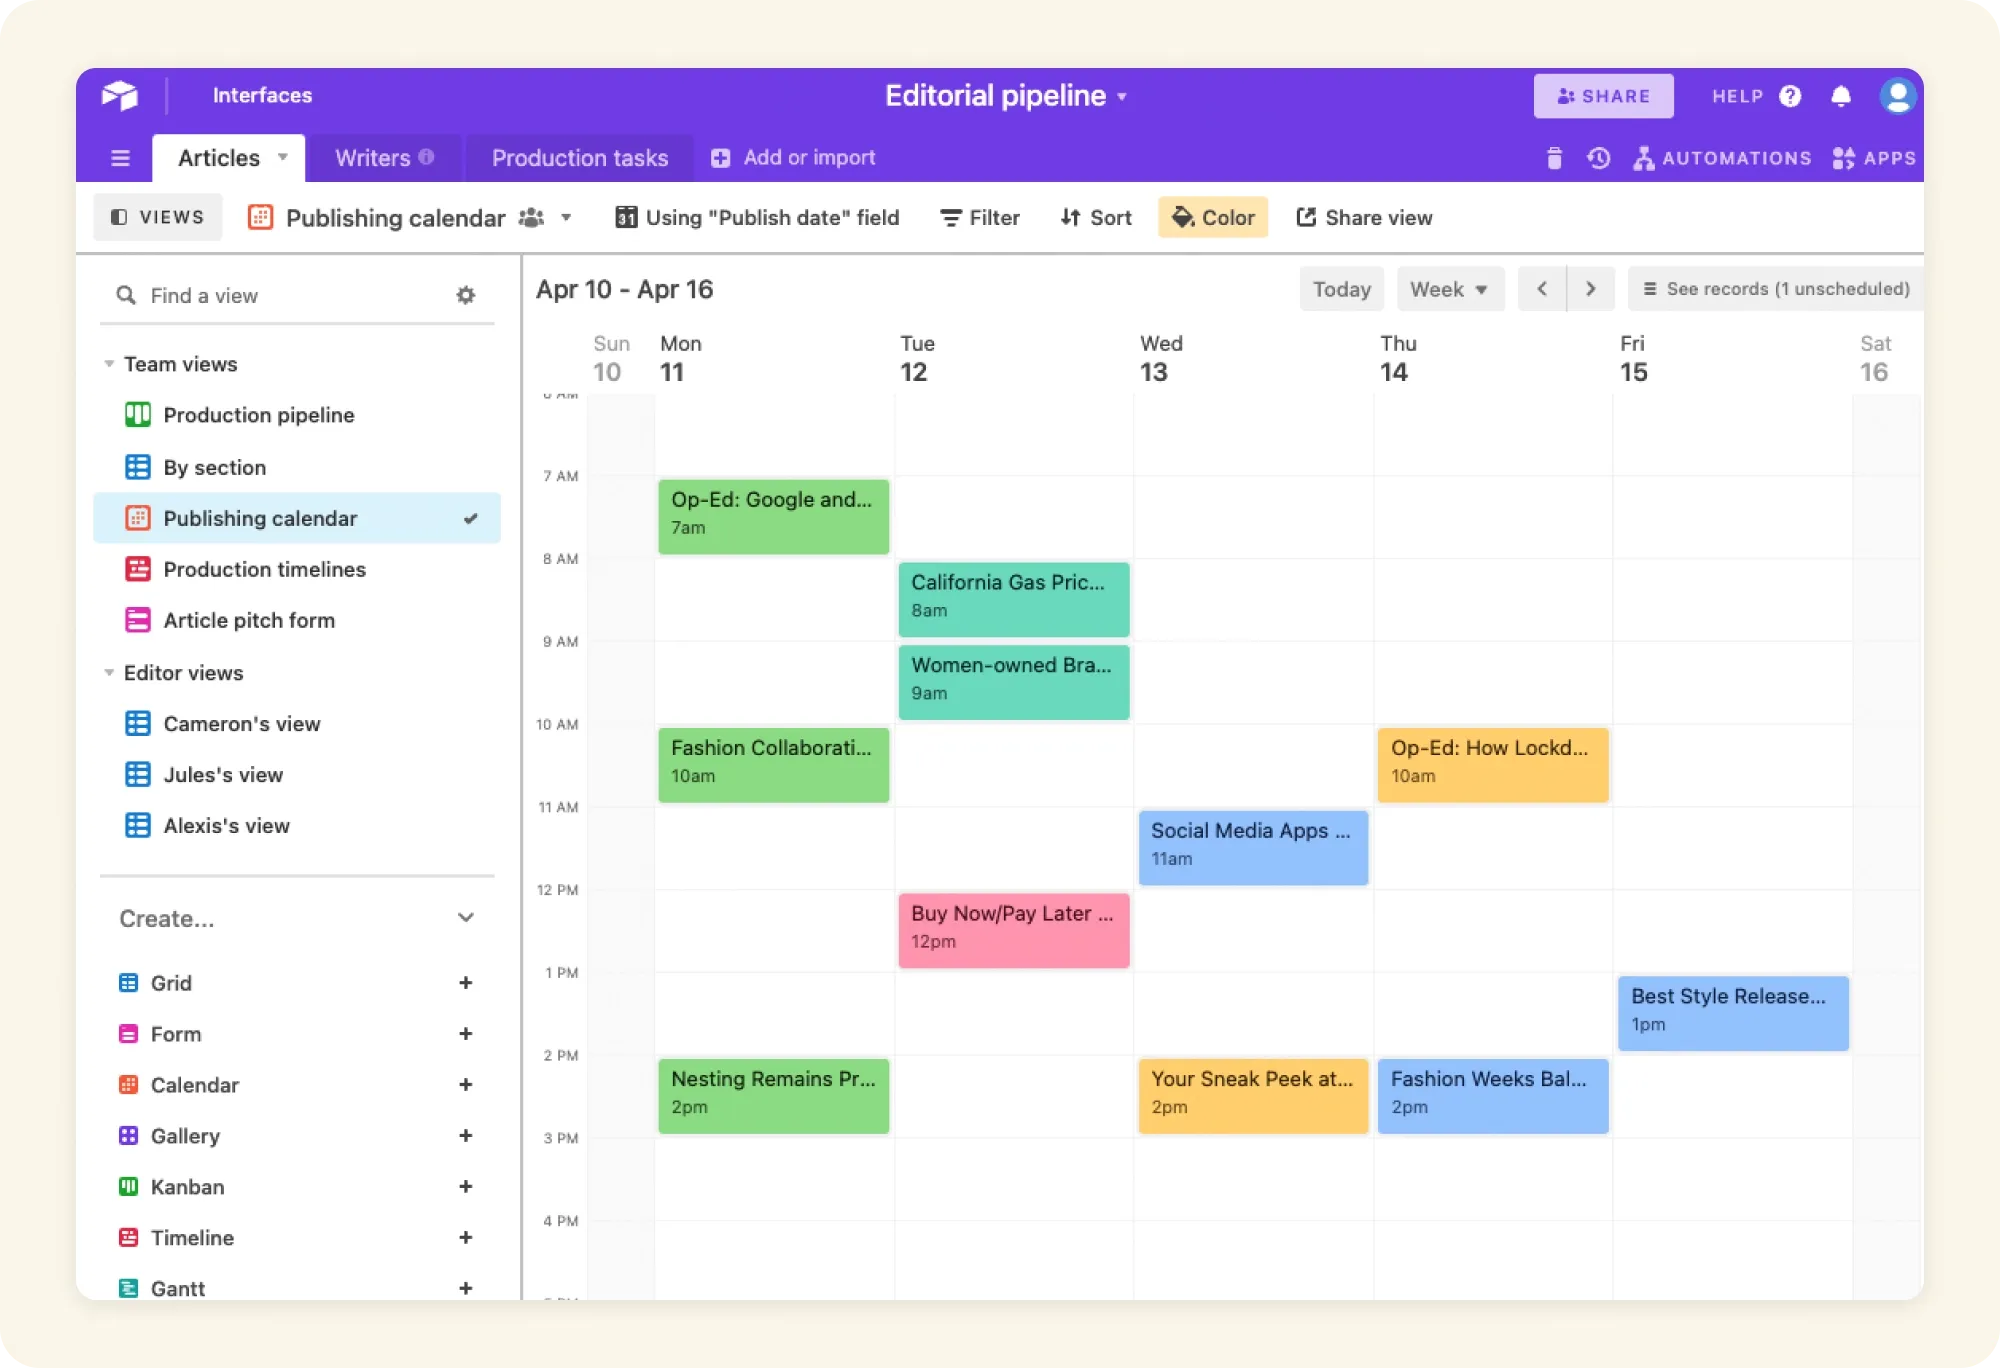
Calendar View: Time-Based Visualization
Calendar View displays records as events on a calendar, perfect for:
- Editorial calendars
- Event planning
- Appointment scheduling
- Deadline management
- Resource allocation
- Marketing campaign planning
You can color-code calendar items by any field value and toggle between month, week, and day views.
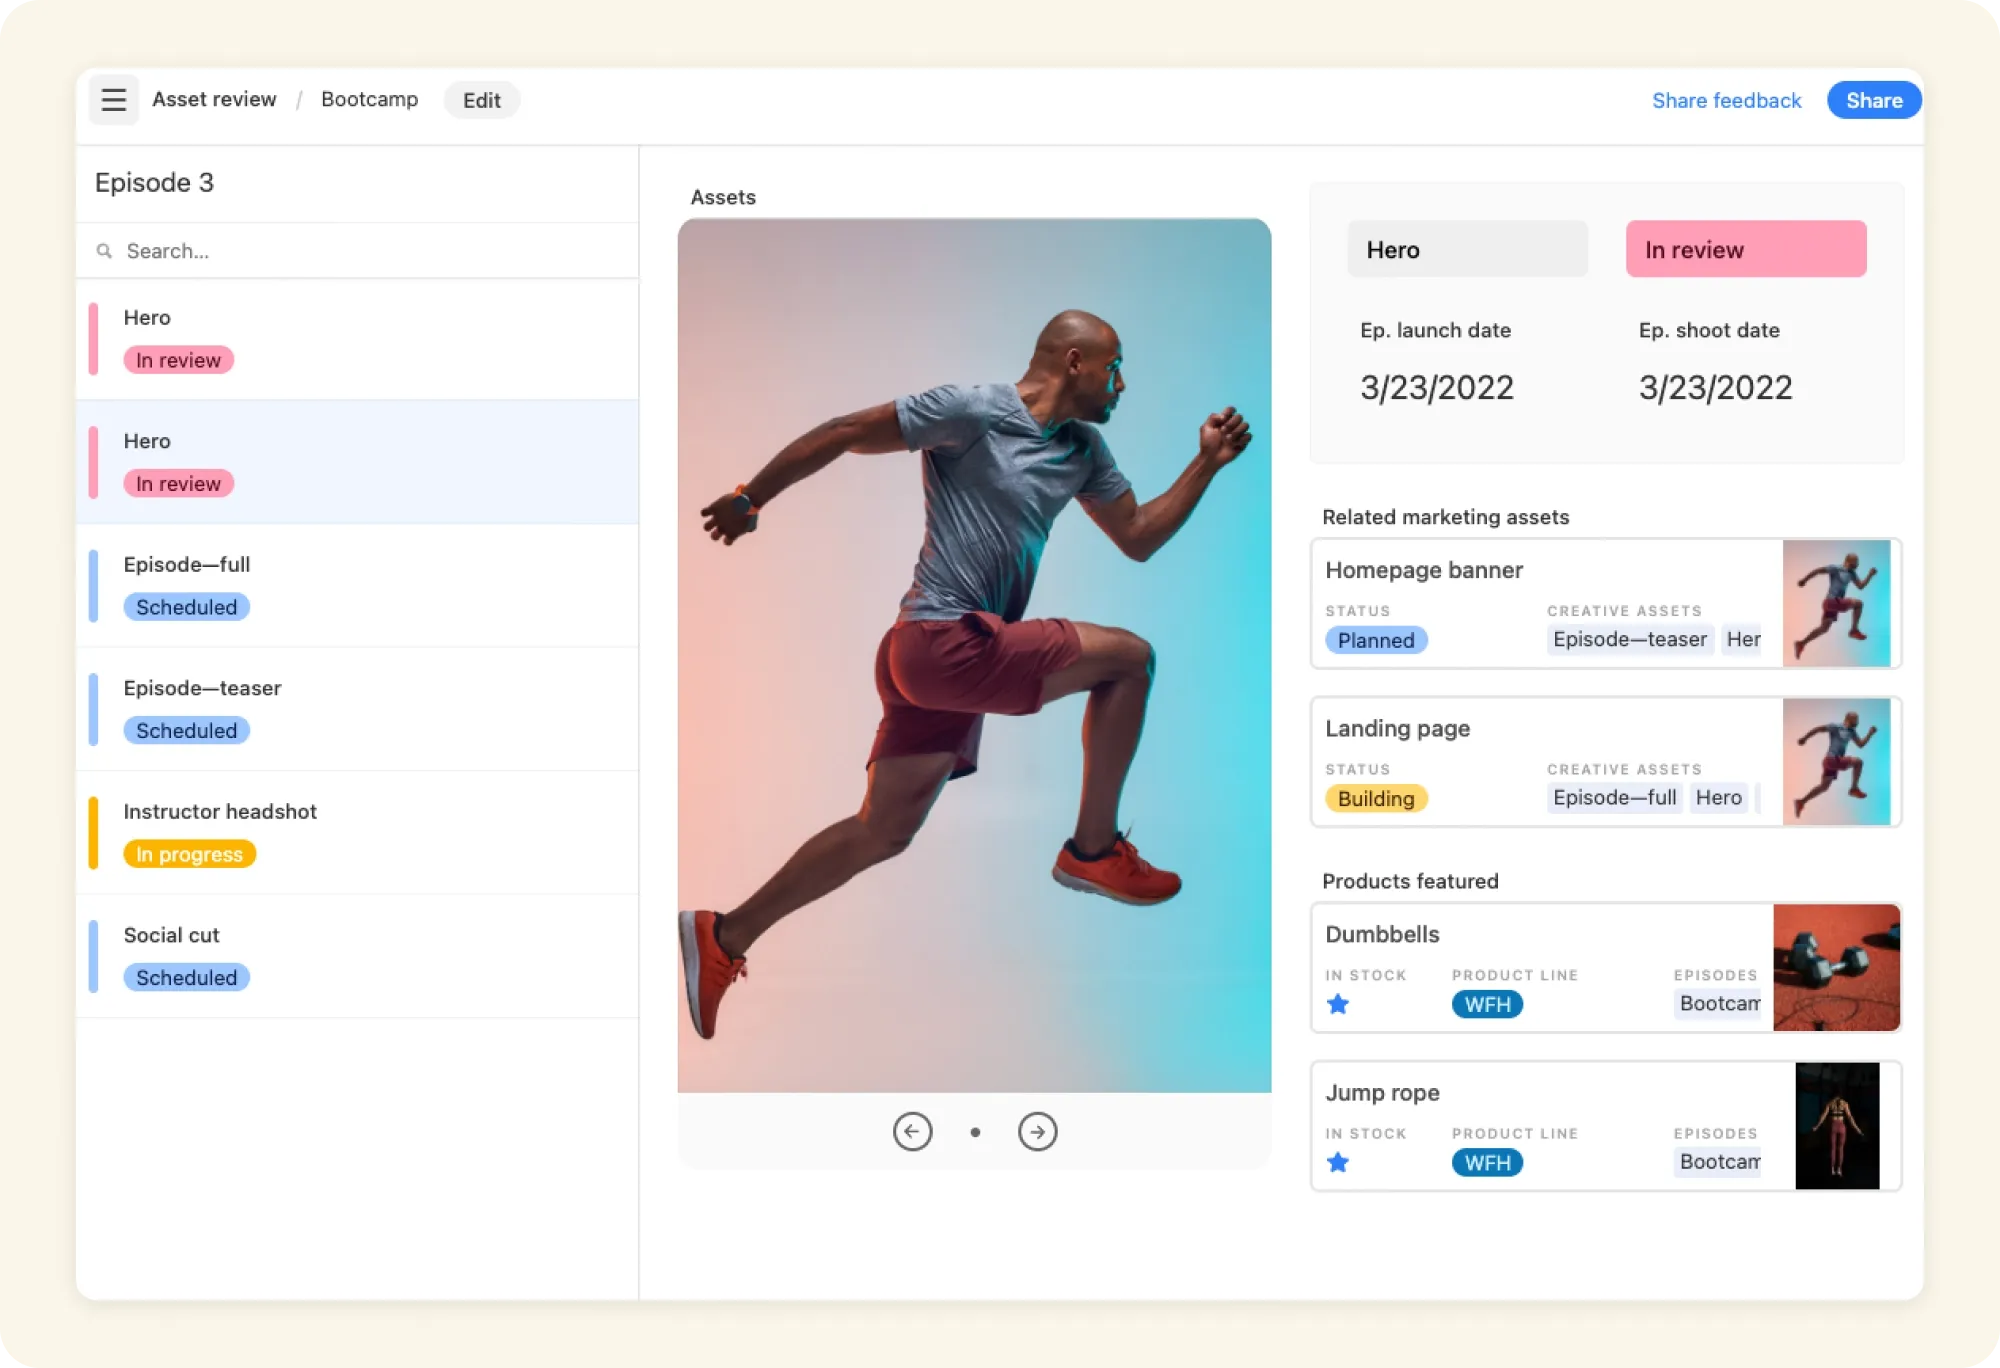
Gallery View: Visual-First Approach
Gallery View presents records as cards with large images, ideal when the visual component is critical:
- Product catalogs
- Real estate listings
- Digital asset management
- Team directories
- Client portfolios
- Design approvals
This view puts images front-and-center while still allowing you to display key information underneath.
![Image: Screenshot of an Airtable Gallery View showcasing records with images.]
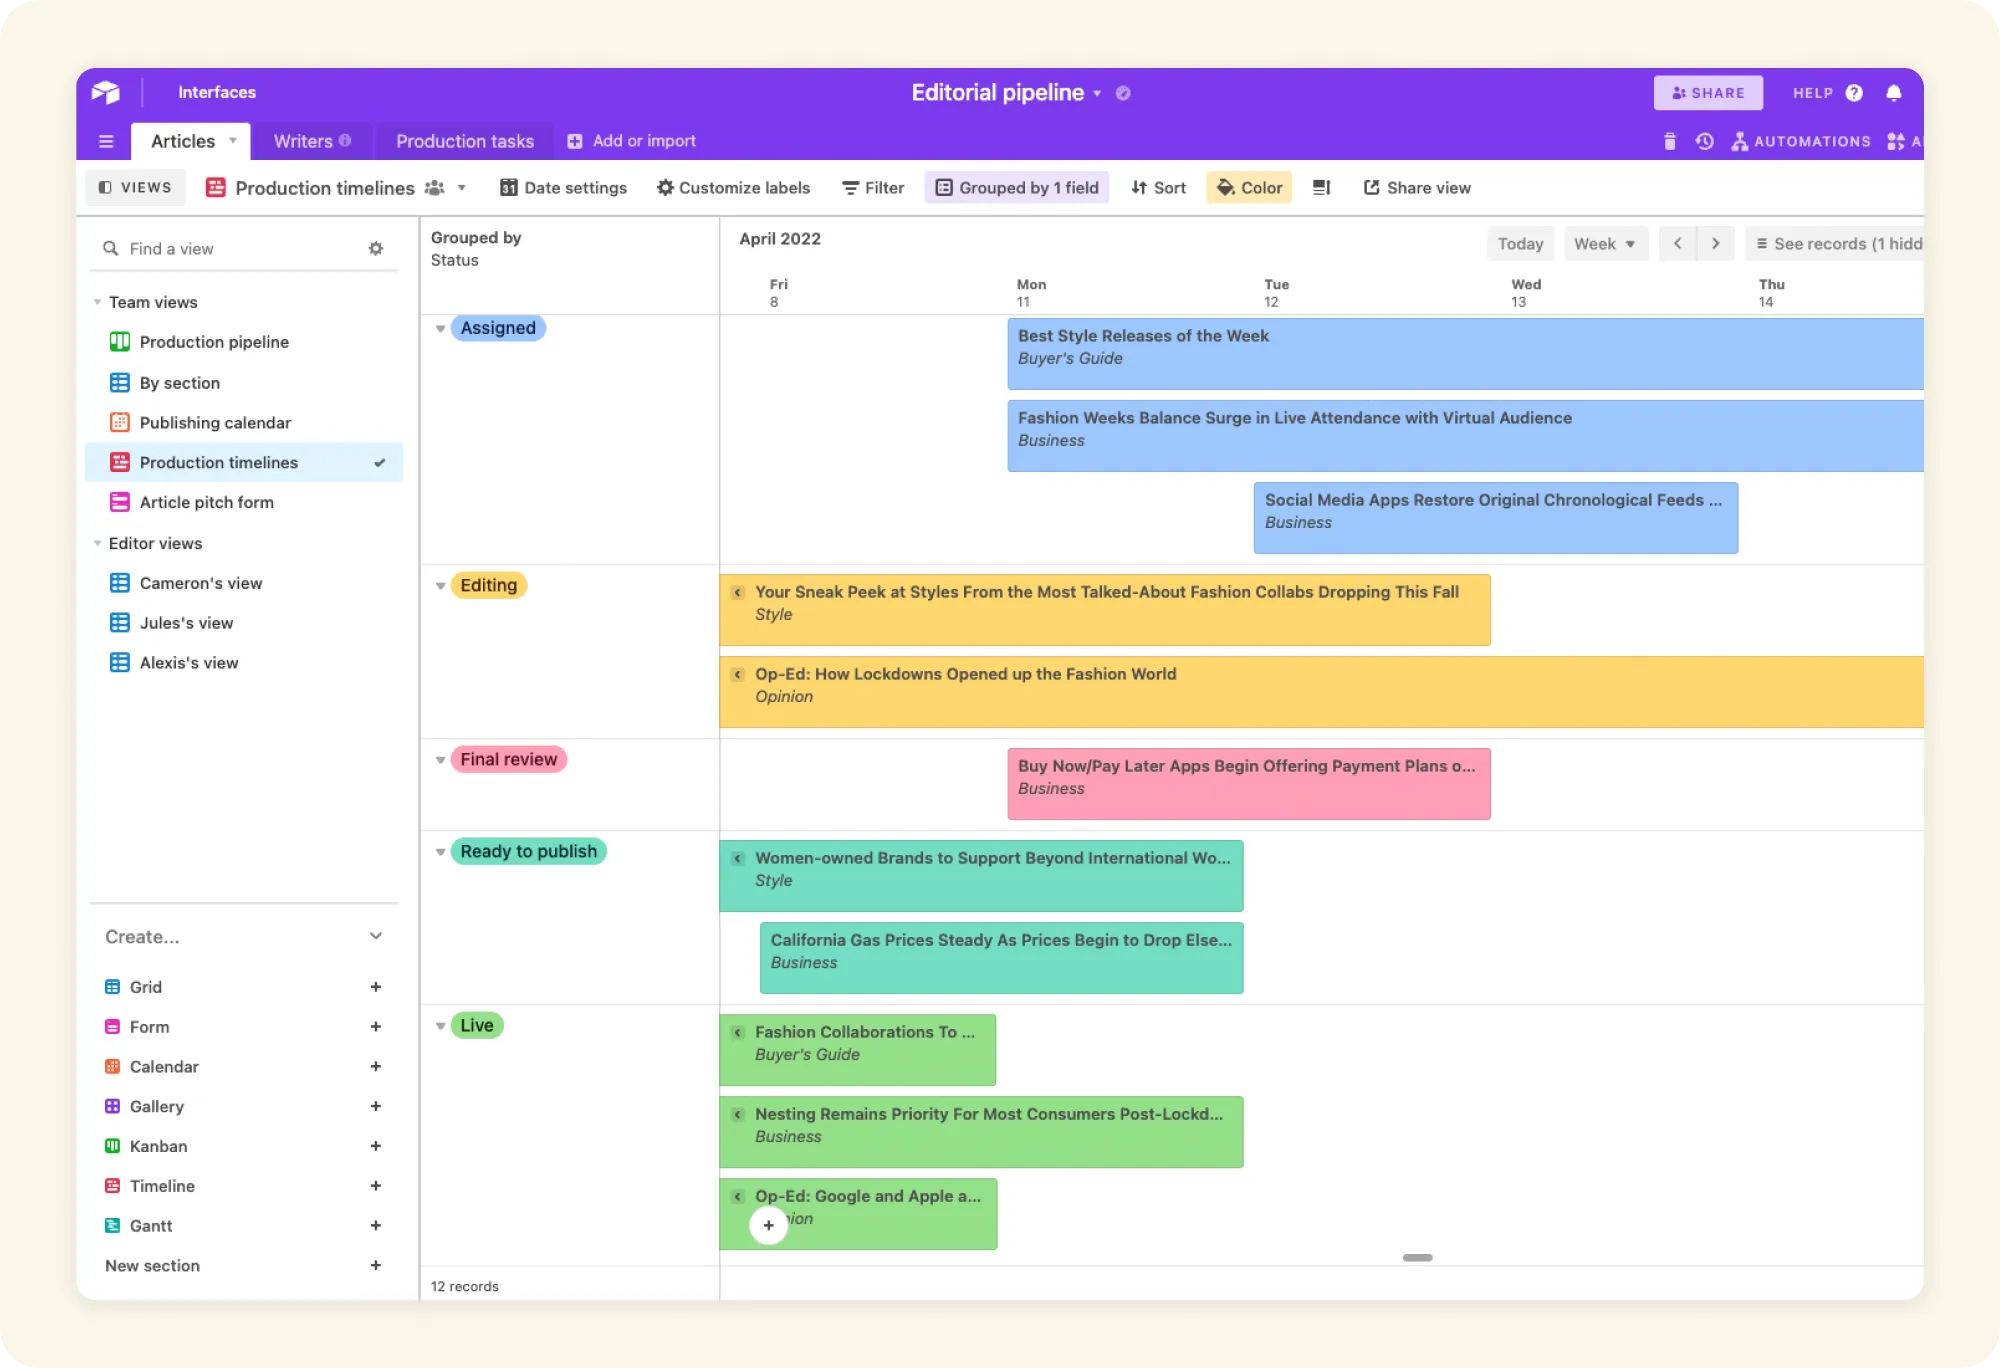
Gantt View: Timeline and Dependencies
Gantt View visualizes projects along a timeline, showing duration and dependencies. Use it for:
- Project planning
- Resource scheduling
- Product roadmaps
- Event planning
- Cross-team coordination
- Milestone tracking
This view is especially valuable for projects with multiple dependant tasks and delivery milestones.
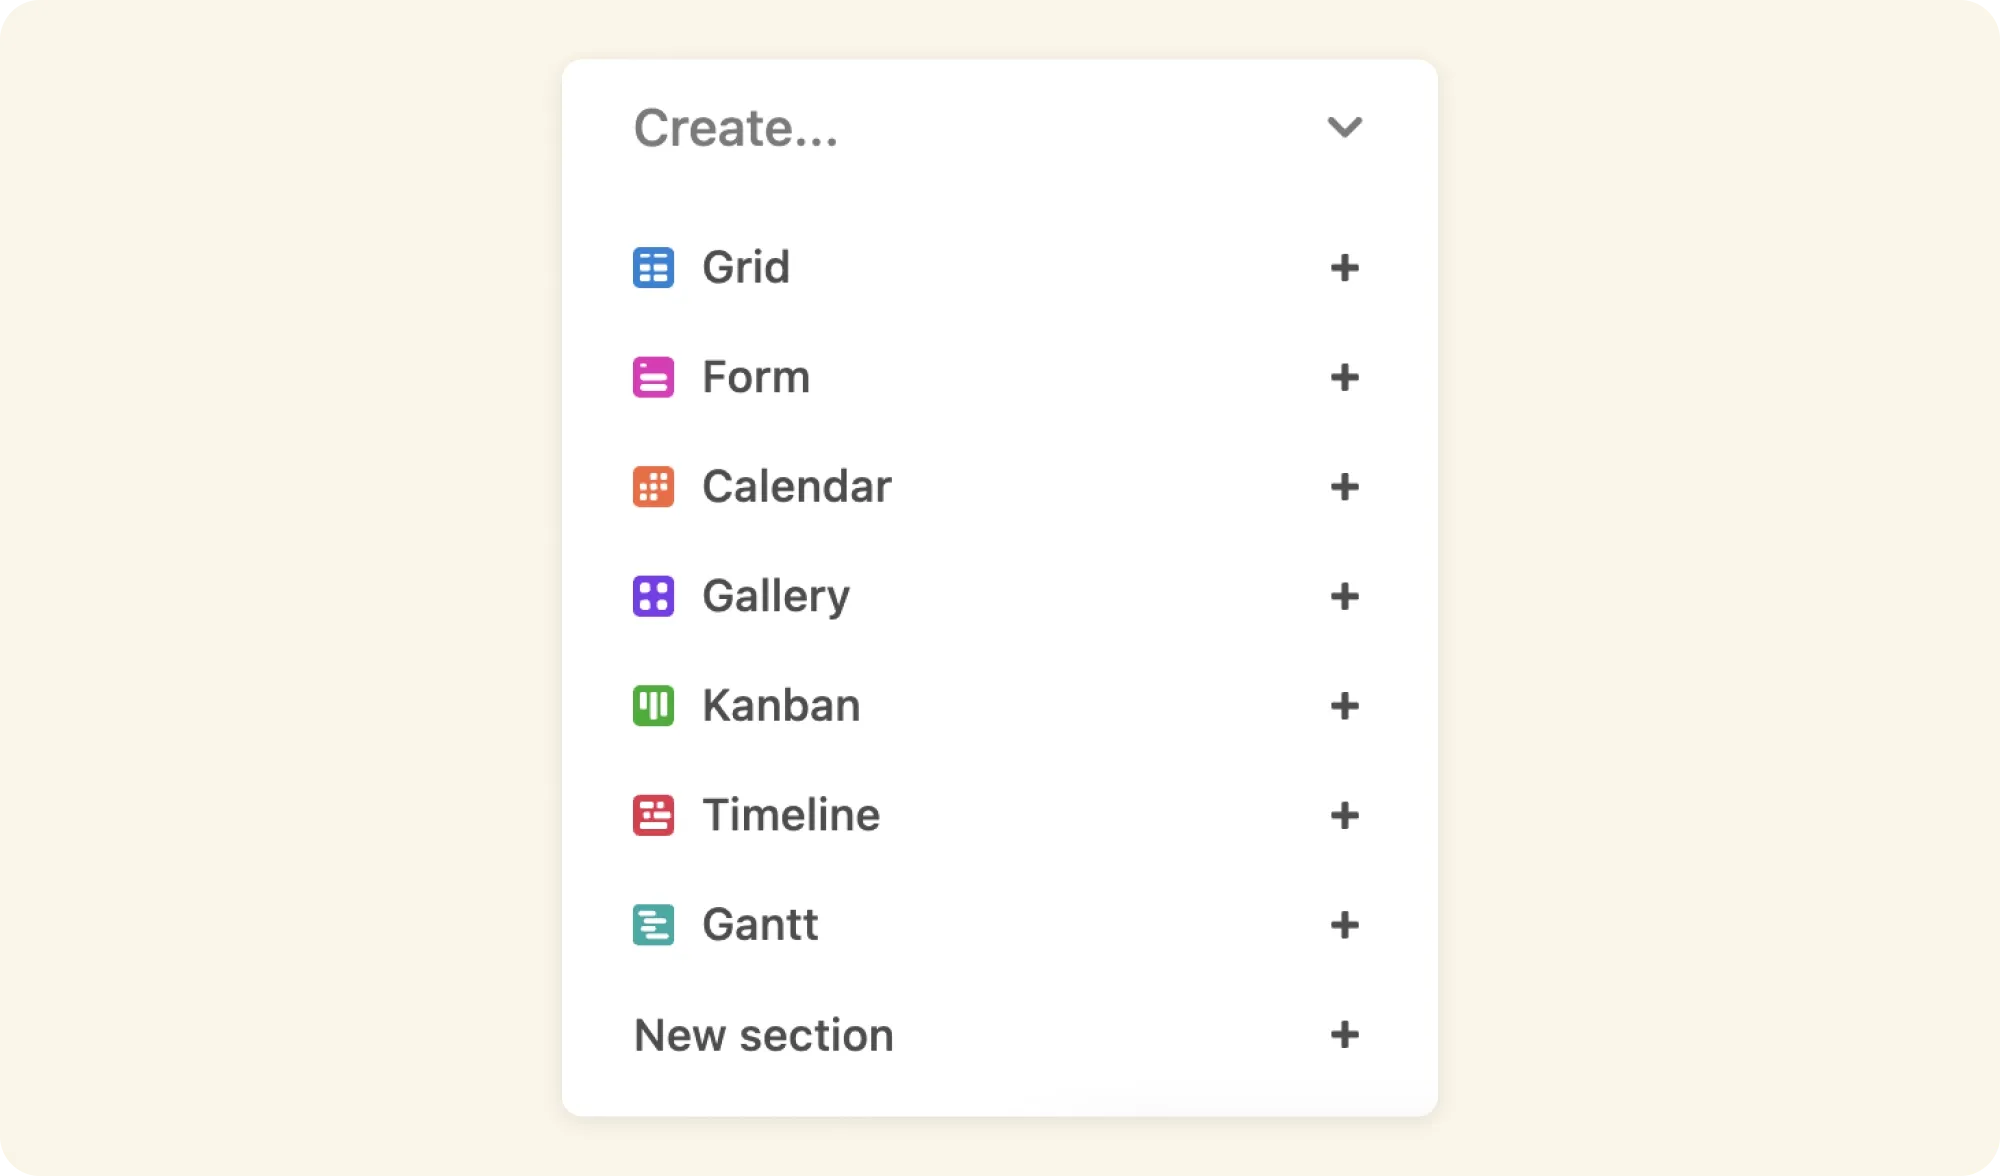
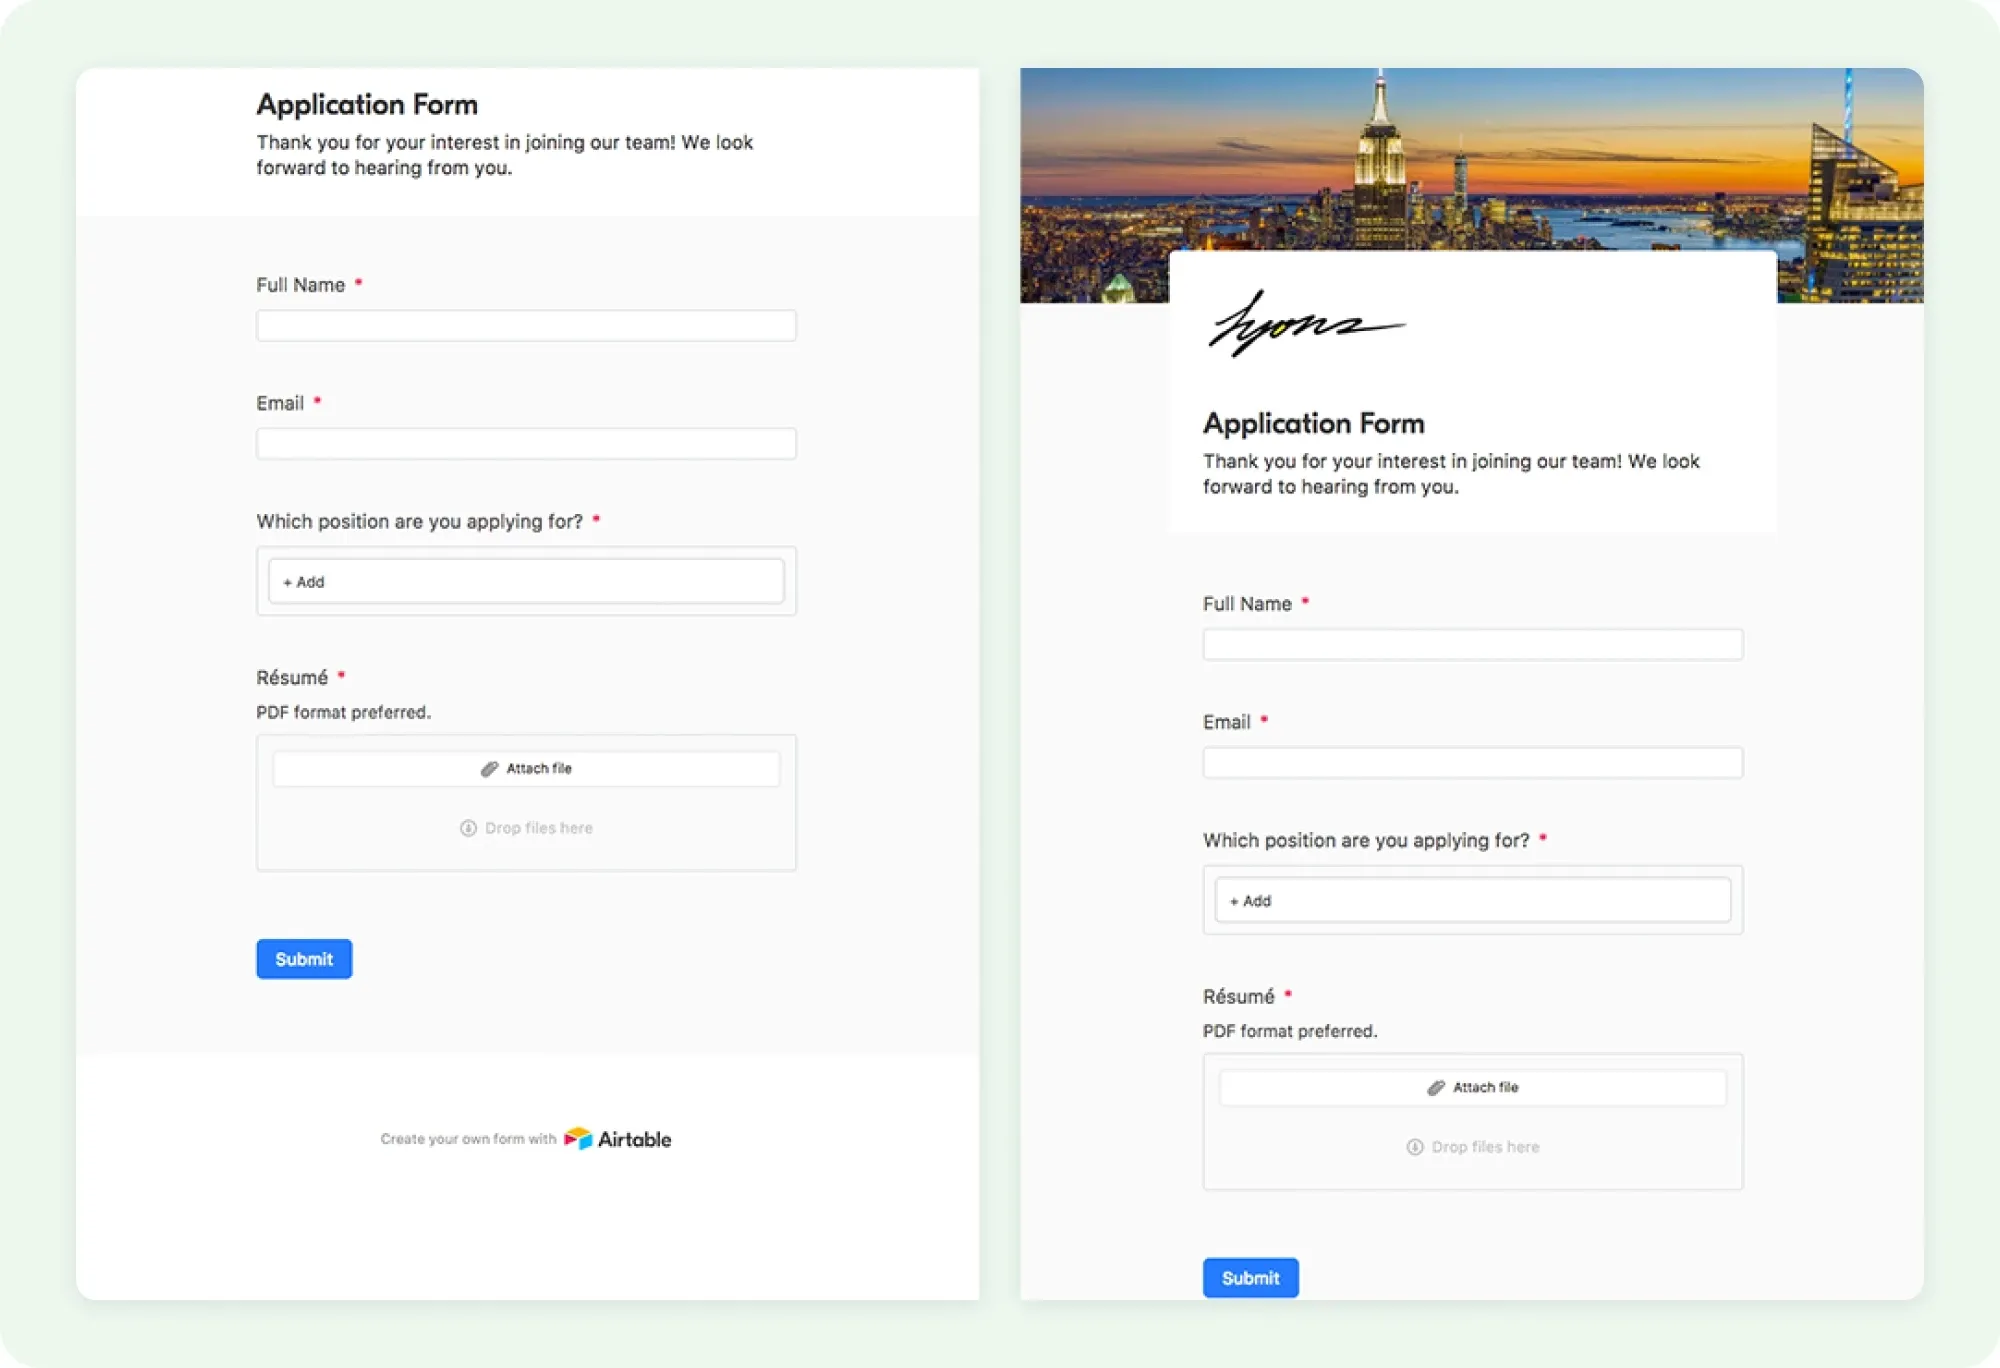
Form View: Data Collection
While technically more of an input method than a visualization, Form View deserves mention as it transforms your Airtable base into a data collection system:
- Client intake
- Event registration
- Feedback collection
- Support requests
- Job applications
- Order submission
Forms feed directly into your database, maintaining data structure and eliminating manual data entry.
Mastering the Grid View
Since Grid View typically serves as the foundation for most Airtable workflows, let’s dive deeper into making it more powerful:
Filtering for Focus
Use filters to create views that show only what’s relevant to specific contexts:
- “My tasks” (assigned to me)
- “Urgent items” (due in the next 48 hours)
- “Blocked tasks” (waiting on external input)
- “Customer projects” (excluding internal work)
Combining multiple filter conditions creates highly specific views that cut through data noise.
Grouping for Clarity
Grouping transforms flat data into meaningful clusters:
- Group client work by organization
- Group tasks by project
- Group content by category
- Group products by supplier
- Group feedback by sentiment
The collapse/expand functionality makes it easy to focus on specific groups while maintaining awareness of the overall structure.
Conditional Formatting for Visual Signals
Add visual cues to help quickly identify important information:
- Highlight past-due items in red
- Show high-priority tasks in bold
- Use color scales for budget utilization
- Apply icons for approval status
- Shade alternate rows for readability
These visual signals reduce cognitive load and help users quickly focus on what matters.
Real-World View Applications
Let’s look at how different Airtable views can be applied to common business functions:
Project Management Views
- Grid View – Comprehensive task list with all details
- Kanban View – Tasks by status (To Do, In Progress, Review, Complete)
- Calendar View – Deadlines and milestones
- Gantt View – Timeline with dependencies
Content Calendar Views
- Grid View – All content with metadata
- Calendar View – Publication schedule
- Kanban View – Content by stage (Ideation, Writing, Editing, Scheduled, Published)
- Gallery View – Visual preview of content with featured images
Client Management Views
- Grid View – All client details and history
- Gallery View – Client profiles with logos/photos
- Kanban View – Clients by status (Lead, Active, On Hold, Former)
- Calendar View – Upcoming meetings and deliverables
Introducing Airtable Interfaces
While views offer different ways to visualize a single table, Interfaces (formerly known as Airtable Apps) take visualization to the next level by allowing you to create custom dashboards that:
- Combine data from multiple tables
- Present information in dashboard-style layouts
- Provide tailored experiences for different team roles
- Include interactive charts and metrics
- Focus on specific workflows
Interfaces are particularly valuable for:
- Executive dashboards showing key metrics
- Client portals with limited, focused information
- Team-specific workflow tools (marketing, operations, finance)
- Simplified mobile experiences
- Specialized process-driven workflows
Unlike views, which are primarily for working with data, Interfaces are about presenting data in context and guiding user actions.
Creating Your Visualization Strategy
To make the most of Airtable’s visualization capabilities, follow these steps:
- Identify key workflows in your organization
- Map user roles to determine who needs what information
- Create core views for each major workflow
- Tailor access permissions based on team roles
- Design interfaces for specialized needs and executive visibility
- Document your system so team members know which view to use when
Remember, the goal isn’t just visualization for its own sake, but to make data more accessible, actionable, and aligned with your business processes.
Conclusion
Airtable’s visualization options transform it from a mere database into a powerful business tool that adapts to diverse needs and workflows. By thoughtfully implementing different view types and interfaces, you can:
- Reduce information overload
- Accelerate decision-making
- Improve team coordination
- Enhance client communication
- Streameline complex processes
Visualizing your data is just the beginning. If you’re ready to try these features, sign up for Airtable using our link! Next, we’ll show you how to automate repetitive tasks and save hours each week with Airtable Automations!
This post is part of the StructLabs.io Airtable Mastery series, designed to help digital professionals graduate from spreadsheets to powerful database solutions.
Affiliate Disclaimer: This article contains affiliate links. If you sign up for Airtable through our link, StructLabs.io may earn a commission at no extra cost to you.
AI Disclosure: This article was drafted with the assistance of an AI model.
Images from Airtable website.